How To Track Website Traffic With Google Analytics

Right now, there are two different ways to track website traffic with Google Analytics. This is because Google is phasing out UA (Universal Analytics or GA3) in favor of GA4 (Google Analytics 4).
I’ll cover how to track website traffic with both currently available versions of Google Analytics. However, I highly recommend that you get a plan in place to switch to GA4 soon because UA will no longer be available on July 1, 2023.
So, let’s start with how to track website traffic in UA.
When you open your Google Analytics account, you’ll see your Google Analytics Home page. It will look something like this:
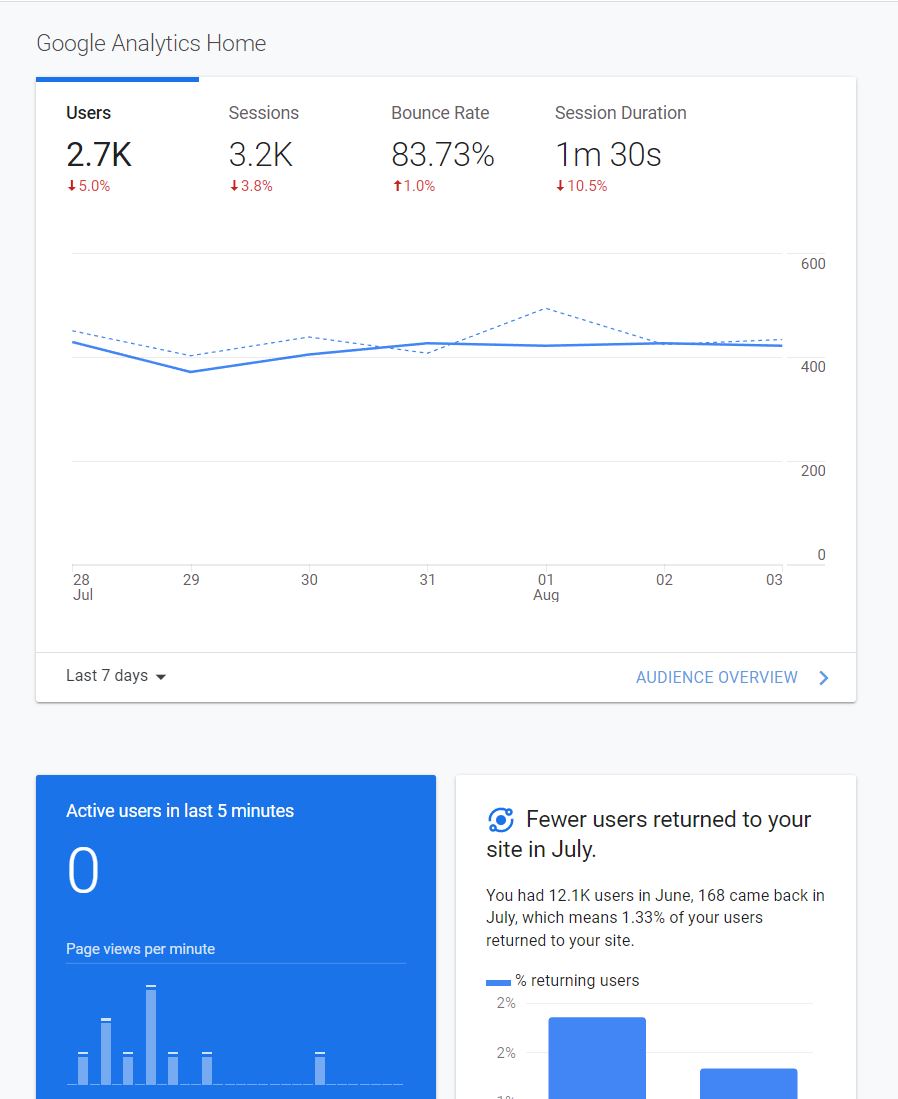
The top box with the titles “Users”, “Sessions”, “Bounce Rate”, and “Session Duration” is the one that can help you track traffic to your website. Whichever title appears in black is the one that is active in the graph below the titles.
In the image above, you can see that the title “Users” appears in black, so the graph is showing me the data on Users. In the bottom left of the graph tile, you’ll see “Last 7 days”. This means that the solid blue line is how many users visited the site on each of the previous 7 days.
Google throws in some additional data on this graph with the dotted blue line. The dotted blue line shows what the solid blue line would have looked like exactly a week ago. So what you’re seeing is a week-over-week change in the data when you compare the solid and dotted blue lines.
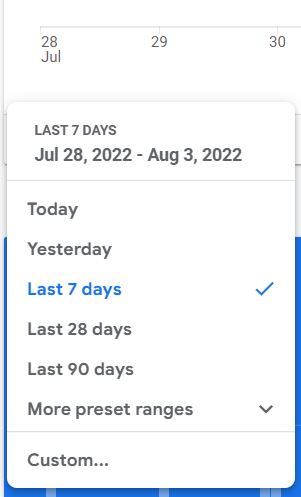
Next to the label “Last 7 Days”, you’ll see a downward pointing arrow. When you click on it, you can change the date range that you’re looking at.
This tile on the homepage is the quickest way to get insight into how much traffic you’re getting to your website.
However, I prefer to look at the data a little differently because I’m curious about where the traffic comes from and not just the total volume.
If you look in the left-hand column of the Google Analytics Home page, you’ll see “Acquisition”. Select Acquisition > Traffic > Source/Medium. Here’s an example of what you’ll see when you make these selections:
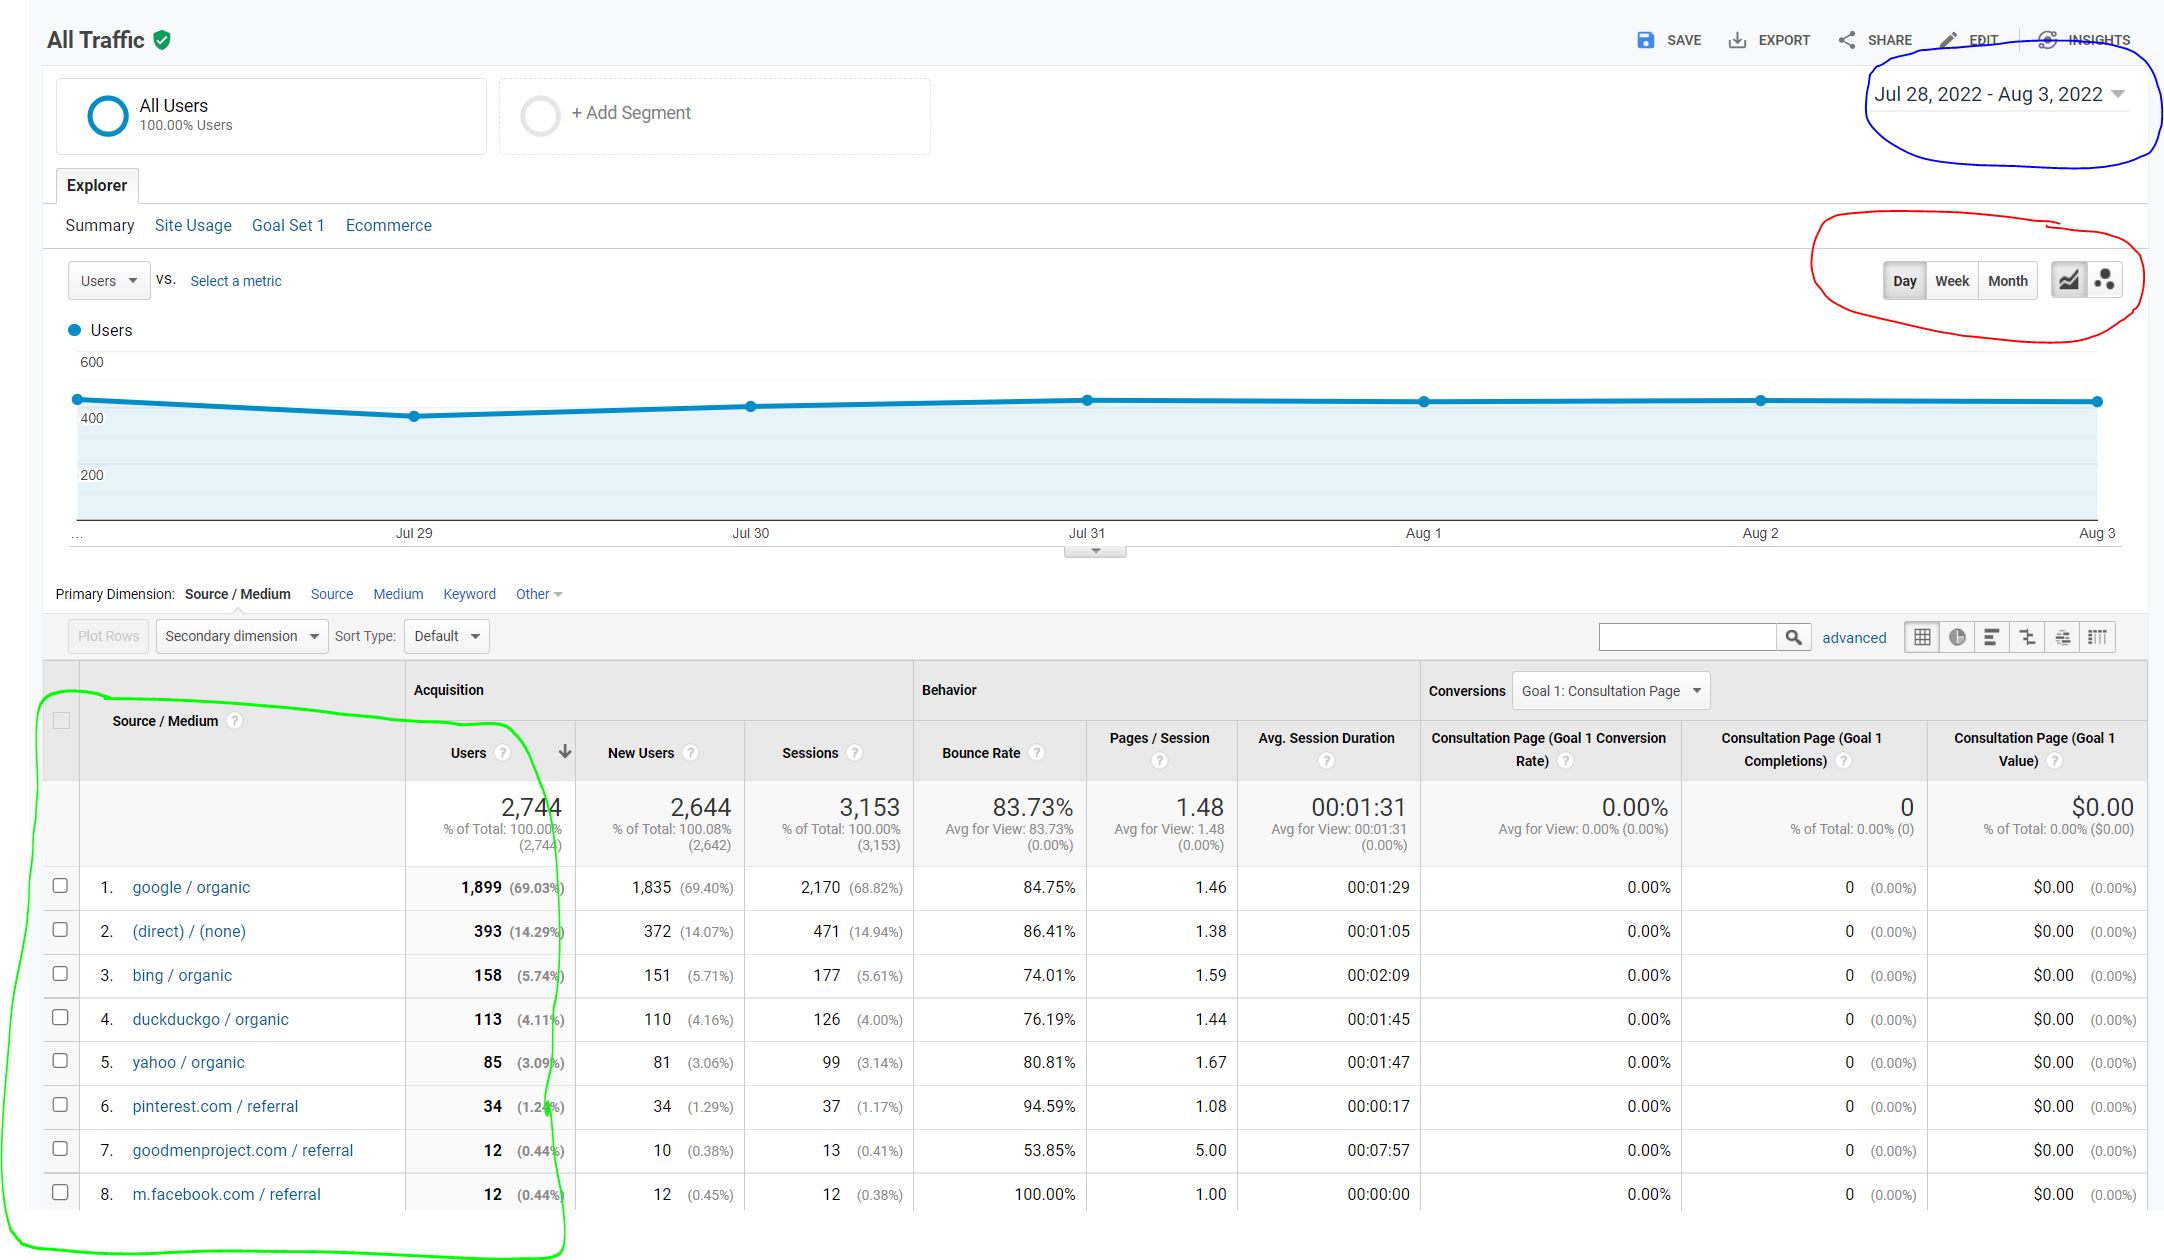
The date range for the data is in the upper right corner of the screen. (I’ve circled it in blue so you can easily find it in the image.)
Below the date range (circled in red) is a toggle that will let you view the data by day, week, or month.
Then in the lower left of the image above is the “Source/Medium” and number of users (circled in green). This sample data says that the top way traffic came to this sample site for the date range selected is through “google / organic”. “google” is the source and “organic” is the medium. (BTW, when your SEO marketing strategies are working well, this is exactly what you want to see.)
How to track website traffic with GA4
The homepage of GA4 looks a bit more utilitarian than the UA homepage as you can tell by looking at the image below.
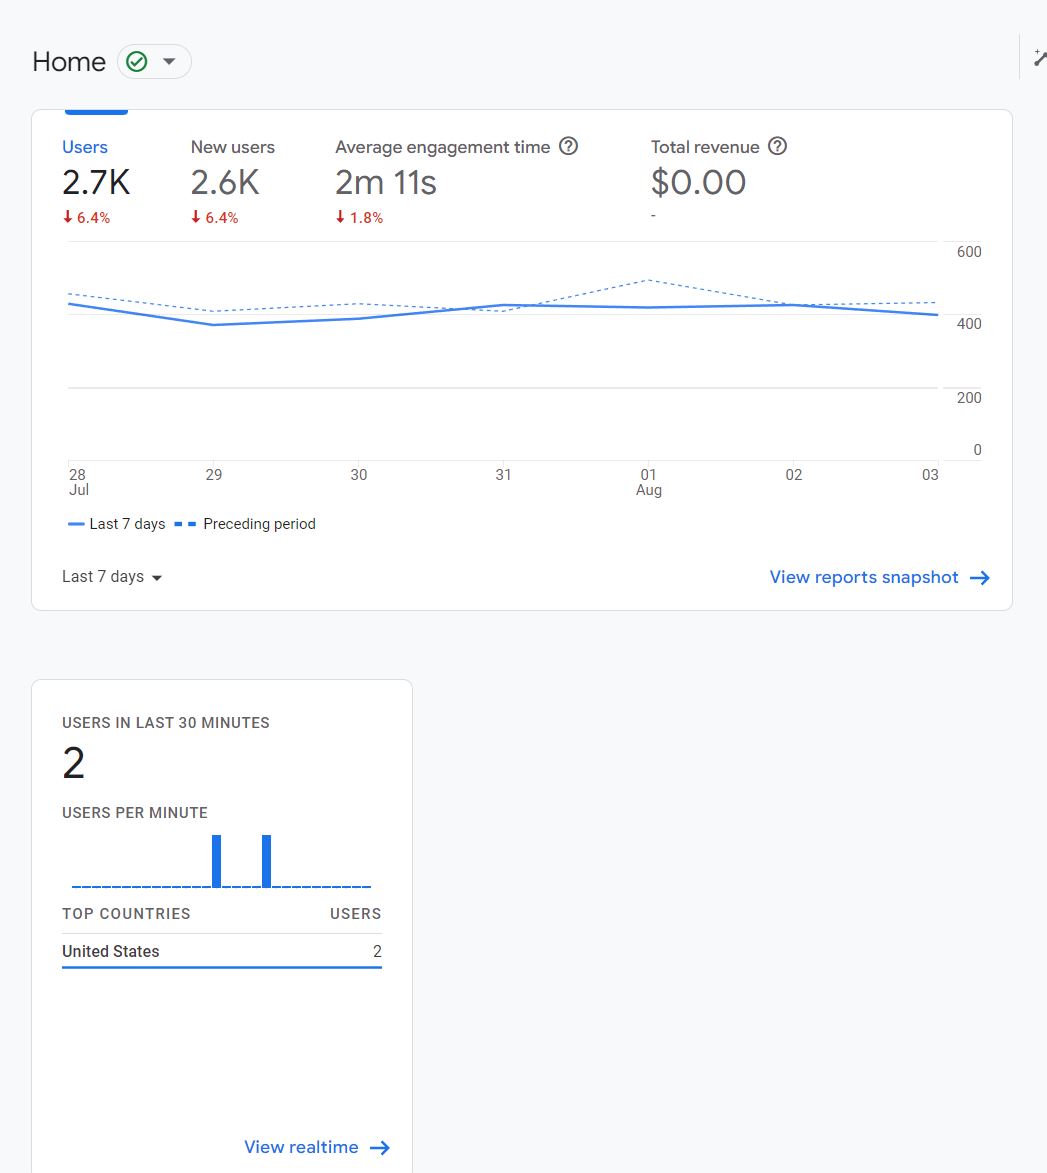
As with UA, the first tile has the title “Users”, but the other titles are different in GA4. In GA4, this tile will also allow you to examine “New Users”, “Average engagement time”, and “Total revenue”. Whichever title appears in blue is the one that’s active in the graph.
In the image above, you can see that the title Users appears in blue, so the graph is showing the data on Users. In the bottom left of the graph tile, you’ll see a legend for the graph to let you know you’re looking at the last 7 days and the preceding period.
Next to the label “Last 7 Days” which appears in the very bottom left of the tile, you’ll see a downward pointing arrow. When you click on it, you can change the date range that you’re looking at.
Although this tile is the quickest way to track website traffic using GA4, I prefer to know how traffic is coming to my website.
To find this information in GA4, look in the lower right corner of the tile. You’ll see a link that says “View reports snapshot –>”. When you click on this link, you’ll see a page that looks something like this:
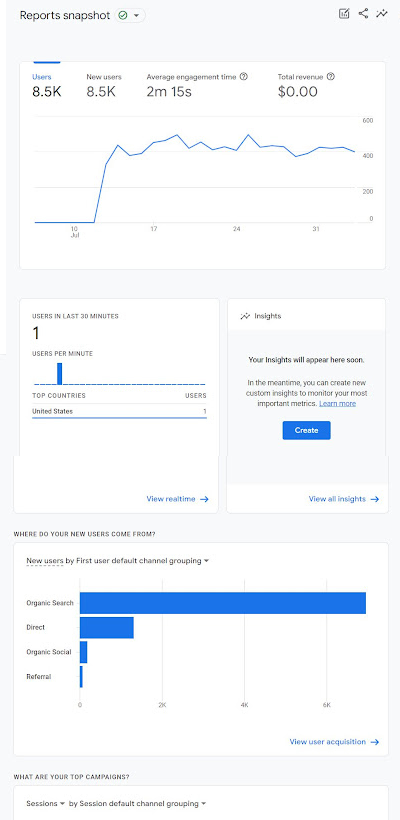
Scroll down and you’ll see a tile with the title “WHERE DO YOUR NEW USERS COME FROM? This tile provides the basic data on where your website traffic is coming from.
This data is helpful at a high level, but I like to look a little deeper to understand things like which search engines visitors are using to find my website and which of my referrals is producing the most traffic. To do this, you click the blue link in the bottom right corner of the tile. It’s labeled “View user acquisition –>”.
What you’ll see when you click on the link is something like this:
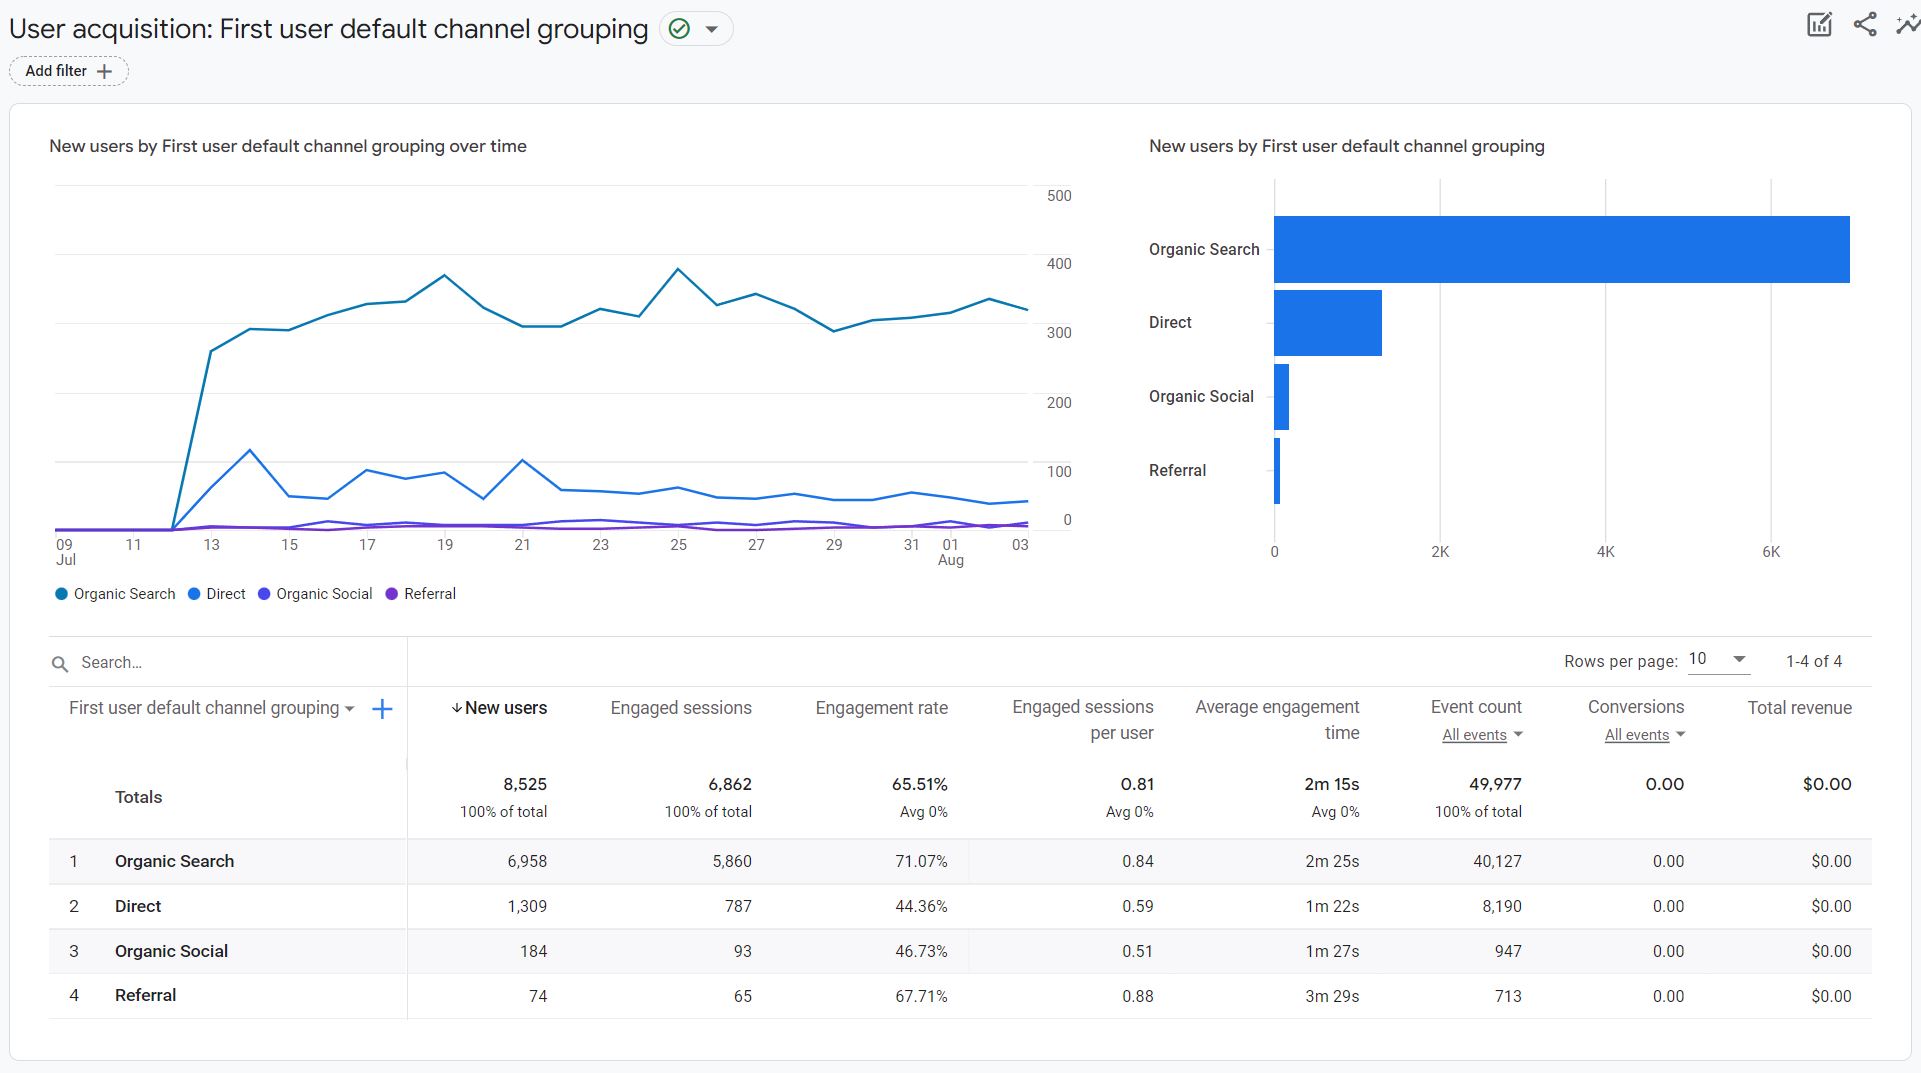
This still doesn’t give you the exact source of the traffic, so there’s another step to take to get there. The first column in the table of data under the graph is labeled “First user default channel grouping” and next to this label is a blue +.
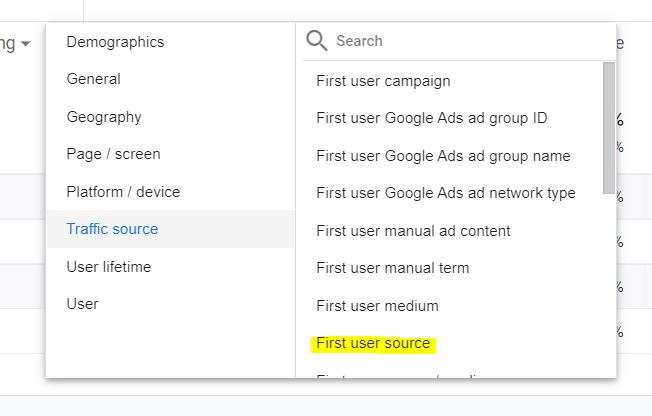
Click the blue + and you’ll see a pop-up that looks similar to this:
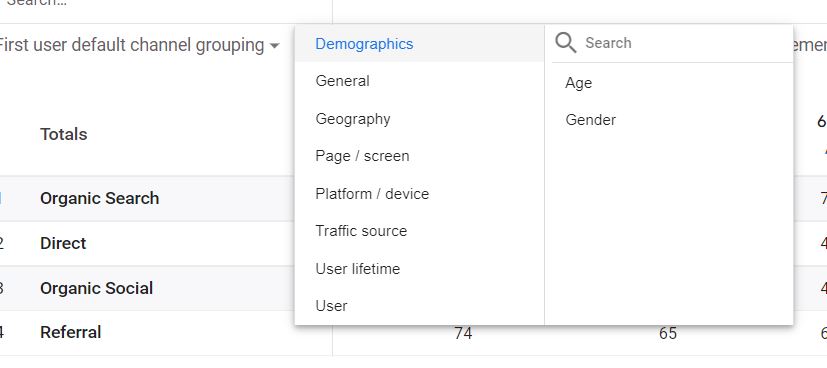
From here you’ll want to select “Traffic source” from the first column. When you do, the second column will populate with a bunch of options.
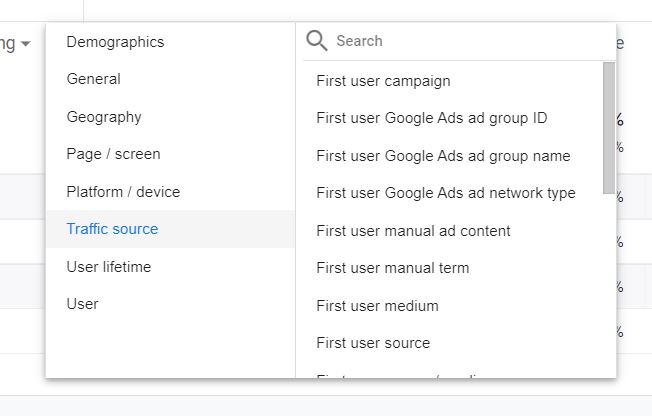
In the second column, you’ll want to select “First user source”.
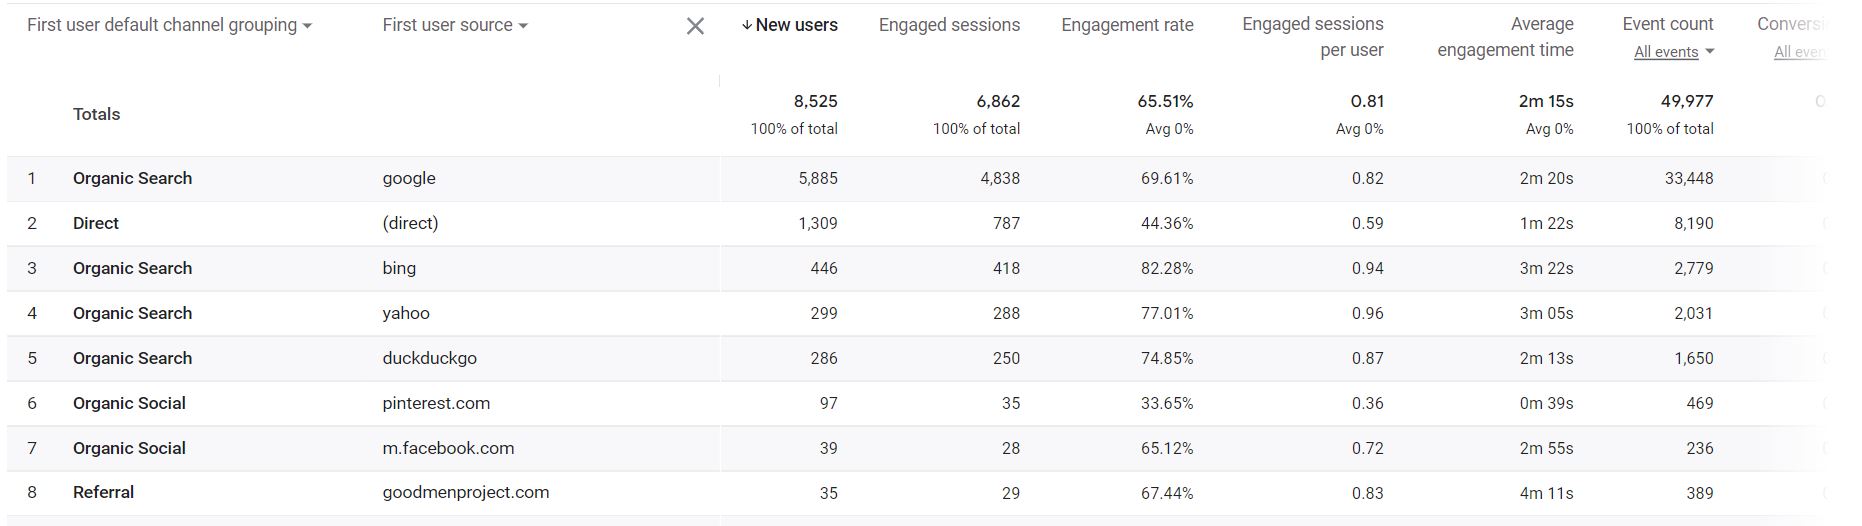
Once you make these selections, you’ll see which search engines your visitors are using. You’ll also see your top referral sources, top social channels, and if you’re running ads, you’ll see that data too.
So regardless of the version of Google Analytics you’re currently running, you can still easily track website traffic.
Need a little (or a lot) of help with online marketing without SEO for your small to mid-sized business? We can help. Schedule your free consultation today.